 Skip to main content
Tomasz Węgrzyn, Head of Operational Technology Unit, ConnectPoint
When I talk to customers about AVEVA PI System, I rarely start with the number of tags, server versions, or data collector architecture. I’m much more interested in the answer to one question: What would you like to know about your facility that you currently can’t find out in just a few minutes?
The answers are similar across very different industries. How much energy do we consume per ton of product, and what causes the differences between shifts? Which pumps are operating outside their optimal range? How long did boiler startups take in the last quarter, and what parameters distinguished the shortest from the longest? What deviations preceded equipment failures?
The data needed for these analyses often already exists. It can be found in PLC controllers, SCADA and DCS systems, and, in many companies, in years of archived PI data. The problem begins when users see thousands of time series but lack a consistent model showing which equipment and processes they belong to, under what conditions they were recorded, and how they should be interpreted.
In AVEVA’s current portfolio, PI System remains an actively developed environment for operational data management. The vendor now also offers it as part of AVEVA PI Data Infrastructure, which extends the PI architecture to support data management from the edge, through on-premises installations, to CONNECT services. For organizations already using PI Server, this means they can continue developing their existing environment and making data available through hybrid architectures.
Data archiving is one layer of a well-designed PI System
PI System is often associated with a historian because PI Data Archive is responsible for storing time-series data. In a real industrial environment, however, archiving is part of a broader data flow that includes data acquisition, storage, contextualization, calculations, visualization, and exchange with other applications.
AVEVA’s current portfolio clearly illustrates this division:
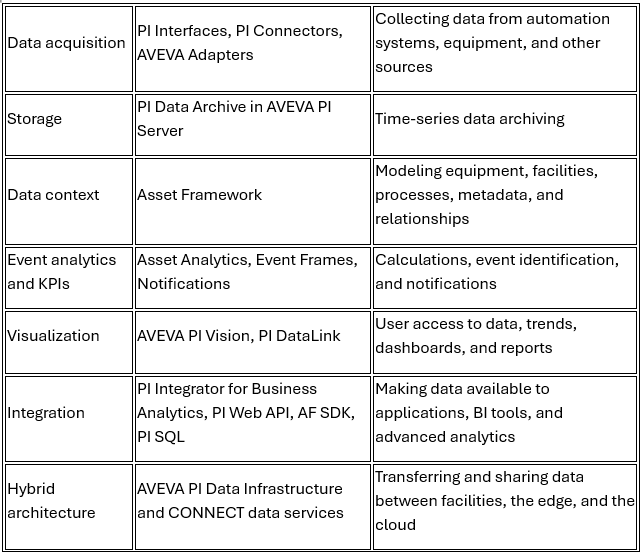
PI Interfaces, PI Connectors, and AVEVA Adapters remain part of AVEVA’s current data acquisition offering, just as PI Vision, PI DataLink, and PI Integrator for Business Analytics remain available for working with and using data.
During data acquisition and archiving, settings that determine which values are actually passed on are particularly important. In traditional PI architectures, exception reporting is primarily associated with the data acquisition layer, while compression reduces the number of events stored in the archive. These mechanisms must be configured according to the characteristics of each signal. Excessive tolerance can reduce the visibility of brief changes that may be important for later analysis, while overly conservative settings lead to storing large volumes of data that provide no additional information. However, the biggest change I usually see in how PI System is used occurs at a higher level: data context.
Asset Framework turns a list of tags into a facility model
Knowing that a temperature was 87°C at a given moment has limited value without knowing what was being measured. The same value could occur during normal equipment operation, startup, reduced load, or a period when the machine should be shut down.
Interpreting this information requires context: the equipment, operating state, load, recipe or product, nominal parameters, and the behavior of the same asset under comparable conditions.
Asset Framework, or AF, serves as the operational data model within PI Server. It makes it possible to represent a structure familiar to plant personnel: company, location, department, production line, equipment, and components. The hierarchy can be adapted to the asset model used by the organization, including structures similar to ISA-95 if the company uses that classification approach.
Element templates are particularly useful. A centrifugal pump template can define a common set of attributes: flow rate, suction and discharge pressure, temperatures, power consumption, operating state, nominal parameters, and calculated values. Dynamic attributes can reference specific PI Points, while some information may come from other sources or be the result of calculations.
Once a model has been created for a particular equipment class, it can be applied to additional assets. This means that KPI definitions, analyses, and data presentation methods do not have to be recreated separately for every pump, compressor, or heat exchanger. AVEVA identifies Asset Framework hierarchies, models, and templates as mechanisms for organizing and contextualizing data in PI Server. From the user’s perspective, the difference is significant. A process engineer begins working with an asset called “Pump P-101” instead of a list of tags whose names are primarily familiar to automation engineers. Maintenance, production, and energy management teams can use the same equipment and KPI definitions, reducing the creation of parallel spreadsheets containing different versions of the same calculations.
Asset Analytics and Event Frames enable event-based process analysis
The next step is to move from observing individual values to analyzing what is happening to a piece of equipment or a process.
Asset Analytics enables streaming calculations on PI Server data and recalculation of historical data. This makes it possible to create KPIs such as specific energy consumption, availability, efficiency, cycle counts, and equipment operating time.
A definition included in an AF template can be applied to an entire equipment class, ensuring consistency in how the KPI is calculated. AVEVA’s current product documentation continues to describe the ability to create template-based analyses and backfill historical data. Event Frames introduce another way of looking at a process. They make it possible to record a period with a defined start, end, and set of associated data.
This could be a startup, shutdown, production batch, parameter exceedance, protective system activation, or a period of operation in a specific state.
A practical example
If every boiler startup is recorded as an Event Frame, hundreds of startups can be compared by duration, fuel consumption, temperatures, pressures, and other process parameters. The analysis no longer requires manually selecting time ranges on a trend chart. Instead, users work with a set of comparable events and can examine the conditions that occurred during the best-performing and most problematic startups.
AVEVA describes Event Frames as a mechanism for identifying and recording recurring events with start and end times, such as batches, shifts, startups, or downtime.
At this point, process history begins to answer operational questions. Users can analyze the number of events, their duration, the conditions under which they occurred, and the relationships between them, rather than reviewing dozens of separate trend charts.
Data quality determines the reliability of advanced analytics
PI environments that have been operating for many years regularly experience problems that are not always obvious during routine trend reviews. These include tags without up-to-date descriptions or units, incorrectly configured exception and compression settings, frozen values from disconnected sensors, incorrect quality states, timestamp offsets, and multiple points representing the same measurement.
Such problems become much more visible when data begins feeding automated KPIs, comparisons across multiple pieces of equipment, or analytical models. A mathematically correct calculation performed on an incorrect signal still produces an incorrect result.
This is particularly important in Predictive Maintenance and machine learning. For supervised models, labeled examples of events and failures can provide highly valuable training data. Anomaly detection methods can also work without large numbers of labeled failures, but they still require representative data from normal operations, the correct operational context, and subsequent validation of results by experts.
Event Frames can play an additional role here. If an organization consistently records downtime, alarms, maintenance work, startups, and other events, it obtains structured time intervals that can be used when preparing and validating analyses. PI System itself provides data, context, and calculation capabilities. Advanced predictive applications may use additional tools. AVEVA Predictive Analytics remains a separate AVEVA product integrated with PI System, offering capabilities such as anomaly detection and estimating the time until a potential failure. PI data can also be made available to custom models and external analytics platforms.
This is why it pays to assess data quality before evaluating the model itself when starting an AI project. If a process engineer, automation engineer, and business user interpret the same tag differently, the problem lies in the data and context layer.
PI System data can be shared without rebuilding the existing environment
Mature PI System implementations often reach a point where data is also needed outside the OT environment: in business reporting, custom applications, data lakes, AI systems, CMMS, ERP, or cloud solutions. AVEVA continues to develop several ways to provide this access.
PI Integrator for Business Analytics prepares PI Server data for use in BI tools and advanced analytics. It allows data to be selected, cleaned, and structured into tabular datasets while preserving the context provided by PI Server. The product remains part of AVEVA’s current portfolio.
Custom applications can use PI Web API, AF SDK, and PI SQL. PI Web API provides access to time-series data, asset metadata, and events through REST. AF SDK allows .NET applications to work directly with the Asset Framework model, while PI SQL makes it possible to query PI data using mechanisms familiar from relational databases.
AVEVA continues to list all these technologies as current PI System developer technologies.
CONNECT data services are playing an increasingly important role in hybrid architectures. AVEVA’s current terminology uses the name CONNECT data services; the older name AVEVA Data Hub is best avoided in new materials. The service integrates natively with PI System and is designed to make contextualized operational data available to cloud applications, analytics, and data science tools.
This allows organizations to develop their existing PI System environments incrementally. Data retained at the facility can continue supporting the daily work of operators and engineers, while selected information can be made available to business systems or cloud services in accordance with the organization’s IT/OT architecture.
PI System development should start with a specific operational problem
If PI System has been operating within a company for several years, the starting point should be to assess the existing environment and select a use case whose results can be verified.
In practice, this process can be divided into four stages:
- Environment assessment. Review component versions and support status, the data acquisition architecture, mechanisms ensuring continuous data transmission, point settings, the quality of descriptions, and the extent to which Asset Framework is being used.
- Problem selection. The team defines a specific operational question, such as energy consumption per unit of production, downtime analysis, startup monitoring, or the behavior of a critical equipment class.
- Model and analytics development. AF structures, templates, calculations, Event Frames, and PI Vision views are created to the extent required by the use case.
- Validation and expansion. Users verify whether the information obtained helps them make decisions. Only after the approach has been validated is it extended to additional equipment, production lines, or locations.
This approach limits the scope of the initial stage while making it possible to determine whether the organization’s problem can actually be solved using data already available in PI System.
In the projects we deliver, we very often find that a company already has a significant portion of the data it needs. Most of the work involves organizing that data, linking it to the appropriate assets, and building logic that describes the process in a way its users can understand. For me, this is precisely where AVEVA PI System demonstrates its greatest value. Process history begins helping process engineers, operators, maintenance teams, energy specialists, and managers answer questions that previously required manually gathering information from multiple sources.
If your company uses PI System and wants to assess how effectively its environment is being utilized, a good starting point is one specific operational question: What information about our facility do we need today that, despite having the data, we still cannot obtain quickly enough?
Check out our AVEVA solutions.
