Releasing the Power of Data: A Step-by-Step Approach with Smart RDM Platform
Data is a valuable resource that can substantially influence the growth and innovation of businesses. Industries must leverage the power of data to maintain a competitive edge. The Smart RDM platform provides a comprehensive suite of features that can aid organizations in realizing the full potential of their data. By utilizing the AVEVA PI system (former OsiSoft PI System) and other applications as a data source, the platform employs analytical capabilities to convert it into key performance indicators (KPIs), reports, insights, and visualizations in diverse contexts.
This article aims to provide a systematic guide that commences from data collection to its detailed workflow, analytics, and data visualization. By employing the Smart RDM platform, customers can expedite their data adoption strategy and derive valuable insights based on their data workflows to propel their business growth.
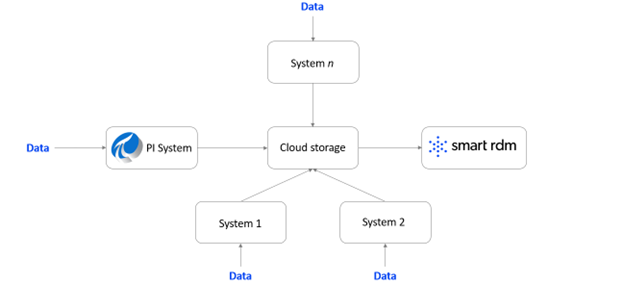
Step 1: Data collection
The initial step, i.e., data collection, holds utmost importance in current business operations as it offers organizations the necessary insights to make informed decisions. The PI System, a real-time data management platform, is extensively employed by industries to accumulate and retain data from diverse sources, including sensors, machines, and production lines. Although not all the data collected via the PI System is used for analysis, chosen data is uploaded onto cloud storage, where it can be stored alongside data from other applications such as ERP, EAM, and CRM, among others. This storage integrates with the Smart RDM platform, consolidating all the required data.
Step 2: Data visualization and validation
The Smart RDM Platform allows users to visualize and validate raw data, with real-time data readily displayed through PI vision dashboards accessible via the platform. Additionally, users can leverage automated correction processes and a dedicated data edition, validation, and confirmation workflow to ensure accurate and reliable data.

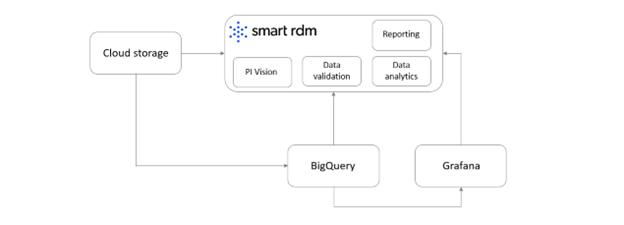
Step 3: Data Analytics
Users can leverage the Cloud Dataflow feature to automate and execute parallel data processing tasks to enhance their data processing capabilities. Google Cloud Storage Bucket can source various file types, which can be uploaded into BigQuery for further processing. Releasing the Power of Data: A Step-by-Step Approach with Smart RDM Platform
Data is a valuable resource that can substantially influence the growth and innovation of businesses. Industries must leverage the power of data to maintain a competitive edge. The Smart RDM platform provides a comprehensive suite of features that can aid organizations in realizing the full potential of their data. By utilizing the AVEVA PI system (former OsiSoft PI System) and other applications as a data source, the platform employs analytical capabilities to convert it into key performance indicators (KPIs), reports, insights, and visualizations in diverse contexts.
This article aims to provide a systematic guide that commences from data collection to its complex workflow, analytics, and data visualization. By employing the Smart RDM platform, customers can expedite their data adoption strategy and derive valuable insights based on their data workflows to propel their business growth.
Step 4: Deeper Data Exploration
Users can perform more sophisticated data exploration based on their requirements using the advanced features of the big data and analysis management module available on the Smart RDM platform. This module allows users to manage algorithms, run algorithms, modify default runtime parameters, and configure the launch context for related elements in the resource tree. Additionally, the platform features a scaling mechanism implemented on Kubernetes to ensure that each analysis runs in an isolated environment without interfering with other script workflows.
Moreover, the Smart RDM platform facilitates the parallelisation of calculations, allowing for the execution of numerous subtasks simultaneously on multiple PODs to reduce the overall task execution time. For extensive analyses, the platform schedules the entire set of analyses, guaranteeing that the results from one analysis become input data for the next.
The outcomes of the analyses can be stored back in the PI system and visualized on PI Vision dashboards or accessed through external reporting tools like MS Power BI, MS reporting services, Grafana, and Tableau. This adaptability makes Smart RDM an adaptable platform that provides a comprehensive view of all data in an industrial setting.

Conclusion
To sum up, the Smart RDM Platform, in conjunction with the PI System and other data source systems or applications, offers customers an opportunity to unleash the potential of their collected data and gain comprehensive insights to enhance their performance. The platform integrates various tools to provide a holistic view of industrial data, including Google Cloud Storage, Big Query, Grafana, Tableau, MS Power BI, and other reporting tools. With its versatility and robustness, the Smart RDM Platform empowers organizations to leverage their data to fuel their business growth and success. To de-normalize and transform the data per specific requirements, with users creating detailed views and tables. Finally, Grafana can be a visualization tool for building robust and powerful dashboards.