How to build a secure and scalable anomaly detection system? – Part one
I spoke with to our expert Wiktor Franus who is in charge of the Big data module, which is part of Smart RDM. I asked some questions, even more came up during the conversation. As a result, this material was created.

How to build a secure and scalable anomaly detection system – simply about things that are not simple at all
For me, the topic of anomaly detection is new. Every day I discover possibilities offered by data analysis. There are so many of them that I have a long way to go to explore at least some of them. I decided to share what I learned thanks to the specialists I work with and draw my knowledge.
Let’s start with what you need to analyze data quickly, efficiently, and adequately, i.e. knowledge and tools.
Knowledge
I’m not writing about PhDs in data analytics or genius skills here, just practical knowledge gained from solving the challenges clients pose to our experts.
Industry knowledge is crucial for effective algorithm design. It allows you to understand the relationships between different factors and adjust the model to include all the elements that affect the analysis outcome. The level of accuracy and usefulness of the information largely depends on the expertise of the people who designed the algorithms. Of course, it is possible to apply well-known and frequently used solutions, e.g. Three Sigma, but expected deviations in results will be very different from those achieved in Smart RDM using the Big Data module.
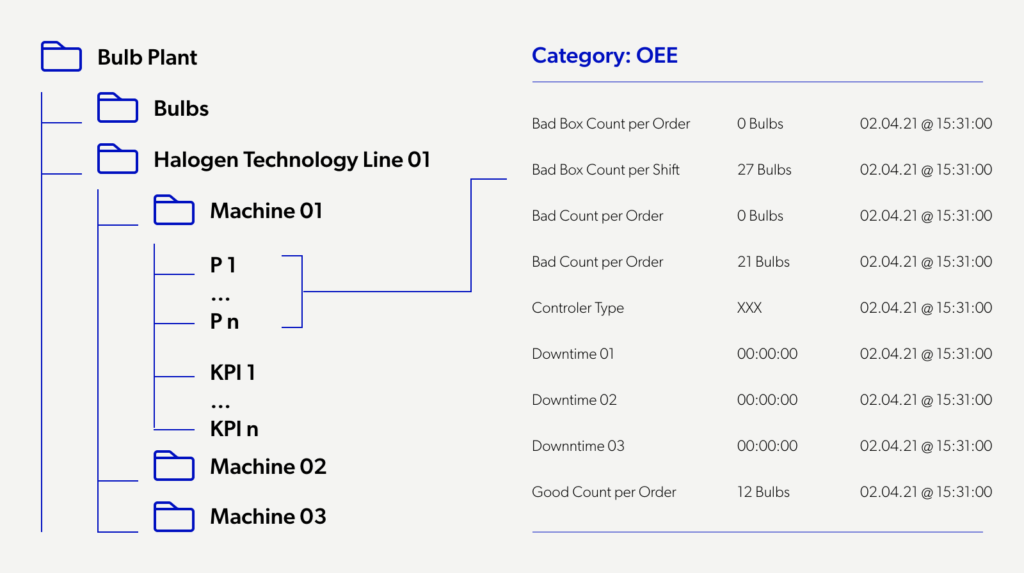
Knowing how to run the process effectively is also the result of experience consisting of many projects, trials, failures, and successes—first, the proper data mapping. To deliver useful analysis results, we need to know what we are analyzing and why. That is why we first prepare a model of each device we plan to monitor. Data are then adequately structured. Thanks to that, we can locate their source, starting from a high level (city, factory, hall, machine, turbine, heat substation) and ending on a single component.
Knowing why we study the data. We consider the analysis in two aspects, monitoring long-term relationships and detecting single events (e.g. failures).
Relationships monitoring includes tracking changes over time, trends, and detecting long-term anomalies in data. To monitor and analyze variations in time, we collect, archive, and process data from devices in the form of a time series, which means the data is stored with timestamps like date and time. Additionally, we store static data, i.e., constant parameters that do not change or change very rarely. These may be elements of device characteristics that parameterize our models. I will write about detecting single events later because one more aspect will be important.
Knowing how to deliver results in the shortest possible time with a high level of information usability. We store all readings in a central repository, which allows us to build a lossless history and research in a wide time range. In this way, we gain access to a tremendous amount of data. It is both an advantage and a threat to the efficiency of the analysis process.
Our experts have developed a model that ensures optimal use of such extensive datasets. Data are collected from the repository in an aggregated form. (e.g., averages, medians, or hourly or daily extremes), selected to meet the requirements of the economics of the solution. In this way, The amount of data downloaded and, consequently, the consumption of server or cloud resources used to conduct analyses is optimized. Next, we check the data for erroneous values. In the process, we first verify data for anomalies, and in the next step, we filter out these anomalies. It is important to note that from our perspective, anomalies are data that exceeds specific statistical values or no data at all.
Knowing how to work with data to obtain reliable analysis results. In the process of preparing data for analysis, we create additional “gaps” by removing data that deviate from the norm, then using linear interpolation* we complete the data series. This procedure creates clean data that is stored in the repository.
Why linear interpolation? For reasons of efficiency and quality of results. When working on a large scale, where thousands or hundreds of thousands of components of the customer’s infrastructure are analyzed simultaneously, the solution’s efficiency is essential. The system has to provide information in the shortest possible time. Too complex solutions would prolong the process without significantly improving the quality of results.

We use industry knowledge when algorithms detect anomalies based on data dependencies, deviations from theoretical values (e.g. heating curve, power curve), and in the process of appropriate categorization of anomalies. For example, for district heating substations, large flow oscillations in a short period can be an indication of incorrectly set control parameters, and in the case of wind turbines, the deviation of the actual power from the theoretical one with potential damage.
Here I will go back to monitoring and analyzing events. This is a separate process. An example is failure detection, during which we operate on a set of data, we do not aggregate or average it. We can do this process this way because we operate at the repository level and do not use additional resources.
I will stop here. You can read how we apply this knowledge to our clients in other blog articles, case studies, and at www.smartrdm.com.
But that’s not the end of the story. To create the big data module, we had to put all the pieces together, i.e. the tools.
In the second part of the article, I will describe the tools that the Big Data module uses and the process of conducting the analysis.
Interview conducted by: Jakub Ładyński

* Interpolation linear – a method for finding approximate values of a function in a given interval by connecting the points at the ends of the interval by a straight line.